Total number of eID cards currently distributed to Belgian citizens
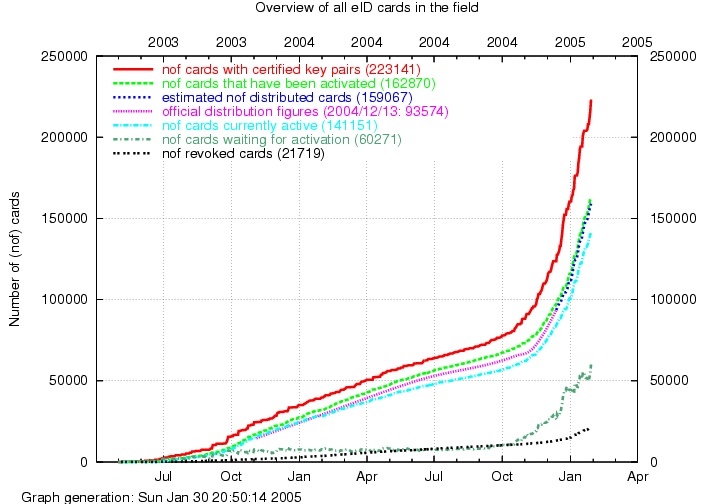
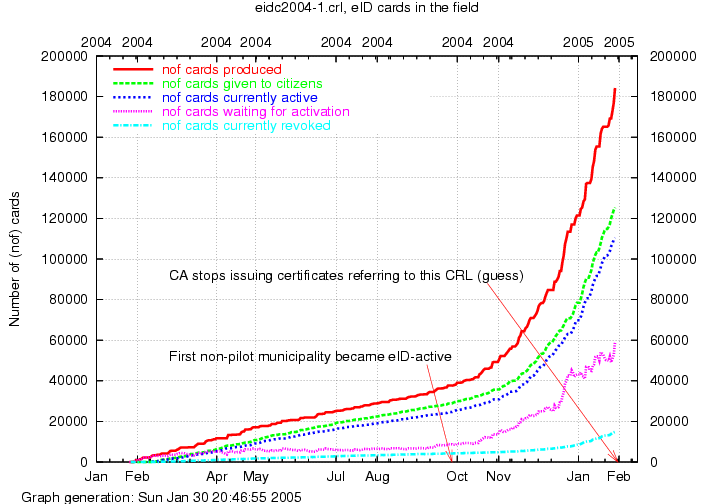
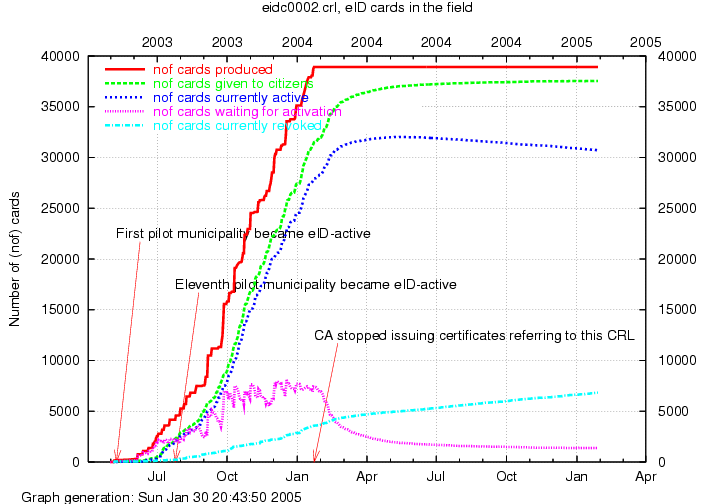
Each line in this graph corresponds to the number of eID cards that have already been produced, activated, or revoked; or that are still kept on hold (i.e., that have not yet been activated). The graph also shows how many eID cards have been distributed to citizens and how many of these cards have been revoked so far. All relevant CRLs have been taken into account to produce this graph.

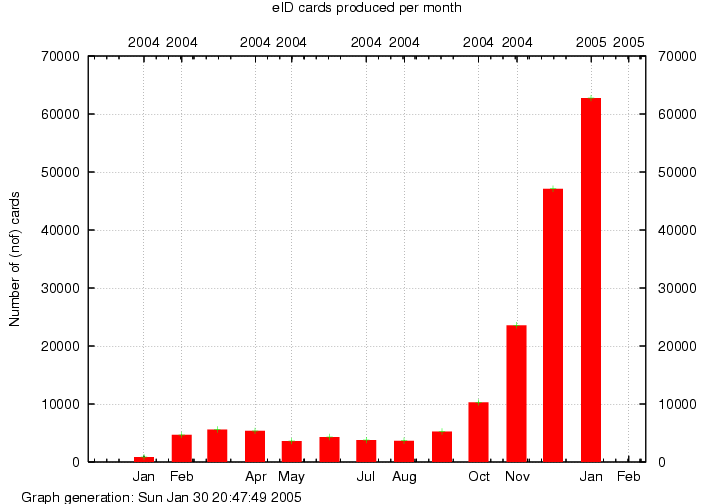
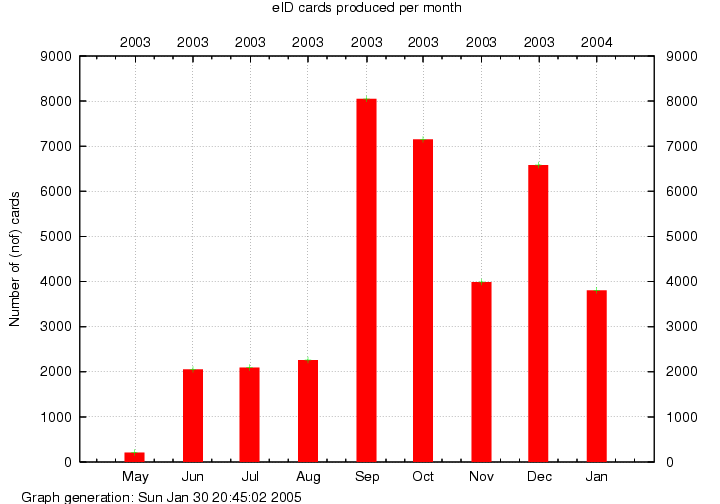
Number of eID cards produced per month
| Complete overview | eID cards that have been produced following a request created in 2005 | eID cards that have been produced following a request created in 2004 | eID cards that have been produced following a request created in 2003 | |
| Number of eID cards that have been produced per month | 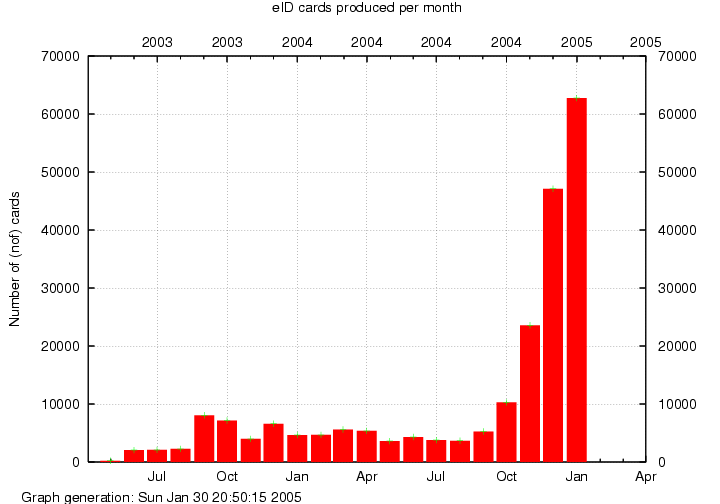 |
 |
 |
 |

Number of eID cards activated per month
| Complete overview | eID cards that have been activated following a request created in 2005 | eID cards that have been activated following a request created in 2004 | eID cards that have been activated following a request created in 2003 | |
| Number of eID cards that have been activated per month, based on the individual CRLs | 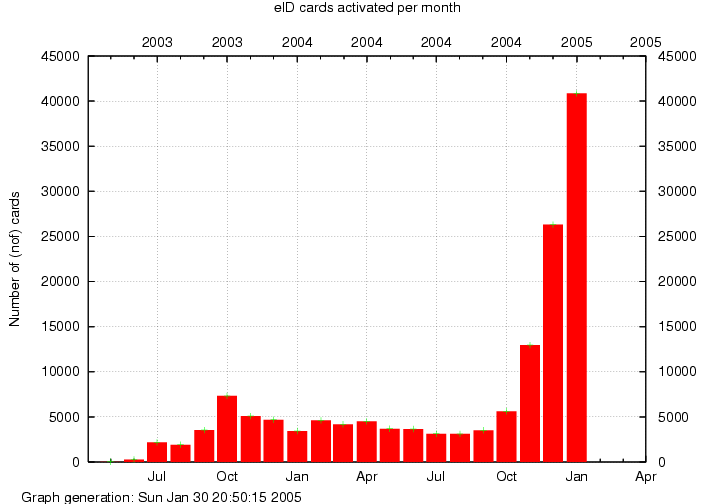 |
 |
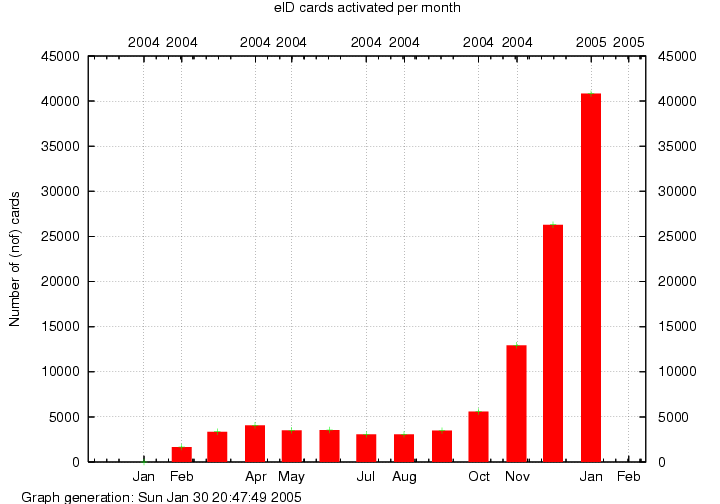 |
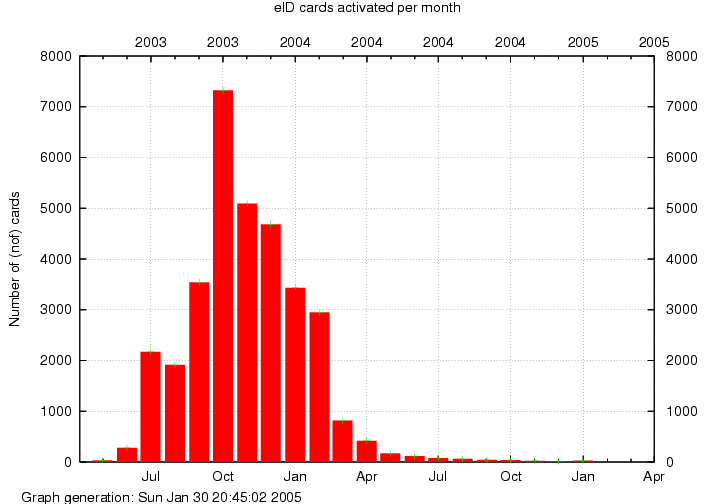 |

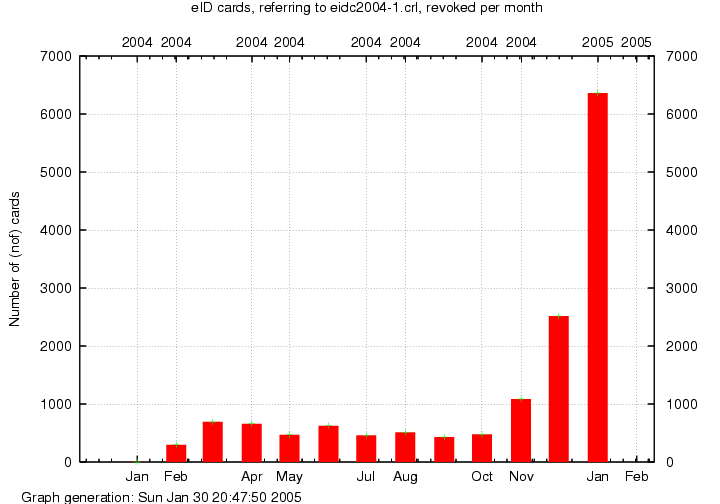
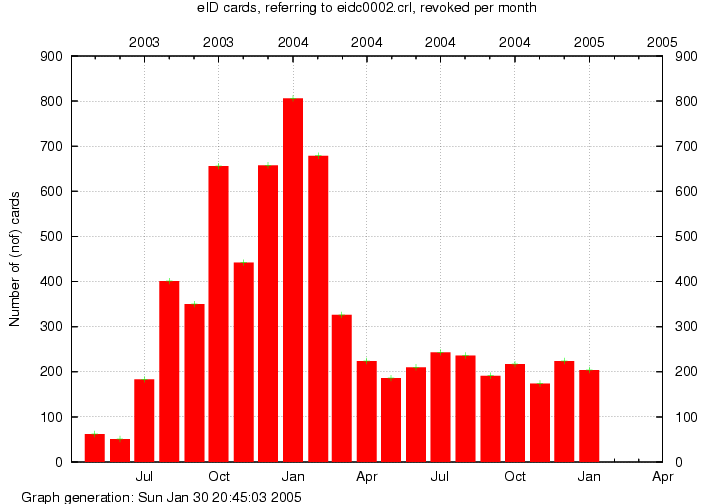
Number of eID cards revoked per month
| Complete overview | eID cards that have been revoked and refer to the main CRL of 2005 | eID cards that have been revoked and refer to the main CRL of 2004 | eID cards that have been revoked and refer to the main CRL of 2003 | |
| Number of eID cards that have been revoked per month, based on the individual CRLs | 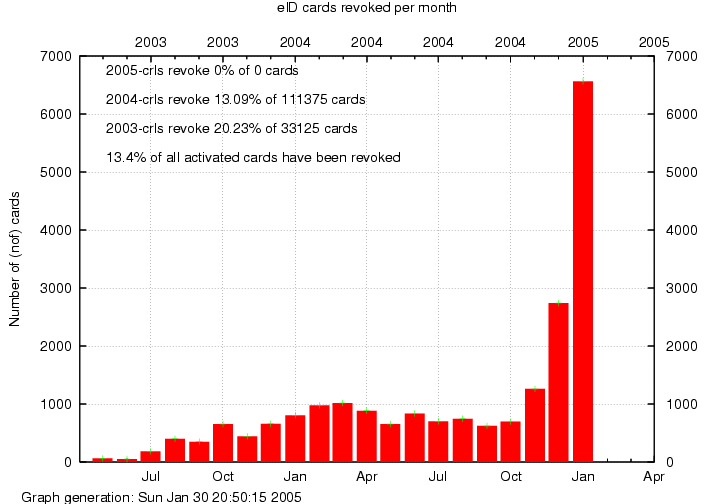 |
 |
 |
 |

Overview per CRL of the transitions of an eID card's state (produced, activated, revoked)
| Information derived from the CRL which covers the eID cards that have mostly been produced in 2005 | Information derived from the CRL which covers the eID cards that have mostly been produced in 2004 | Information derived from the CRL which covers the eID cards that have mostly been produced in 2003 | |
| Number of eID cards that are currently known based on the individual CRLs |  |
 |
 |

Total number of municipalities (out of 589) which issue eID cards
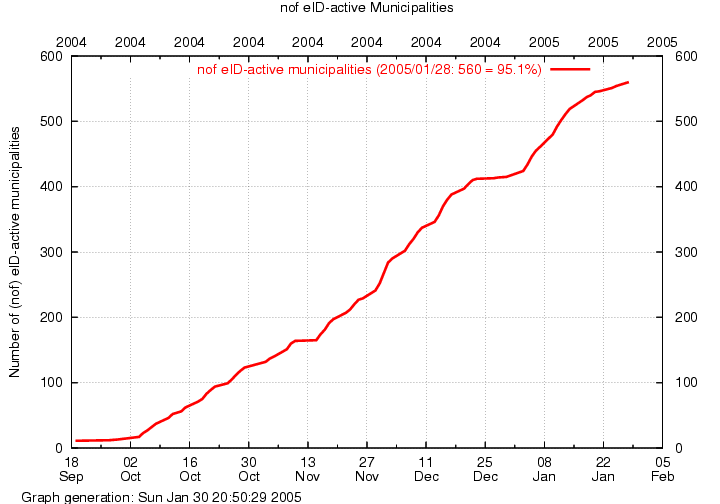
This graph is self-explanatory...

Total size of all Citizen certificate revocation lists in the field
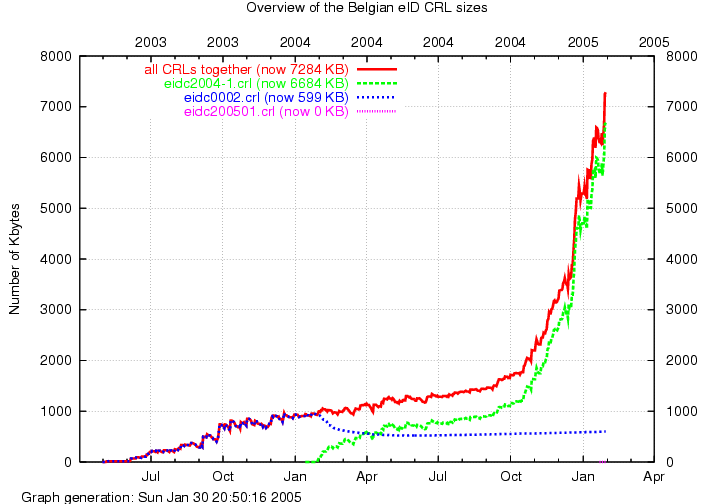
The topmost line in this graph shows how many kilobyte all Belgian eID card CRLs together consist of. The other lines show the sizes of the individual CRLs.

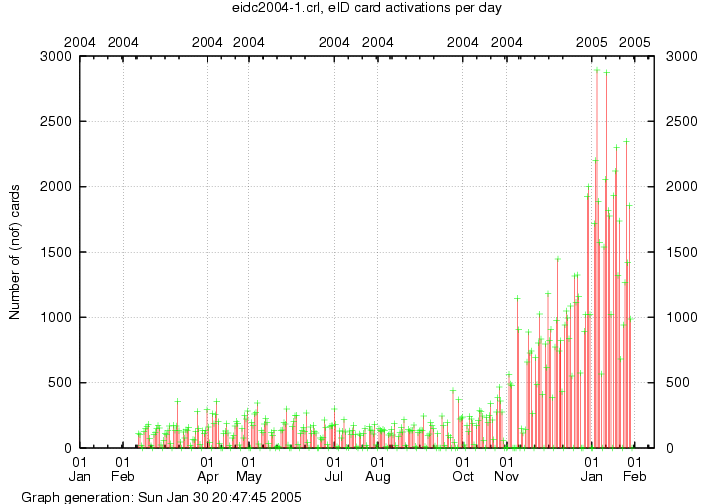
Number of eID cards activated per day
| Information derived from the CRL which covers the eID cards that have mostly been produced in 2005 | Information derived from the CRL which covers the eID cards that have mostly been produced in 2004 | Information derived from the CRL which covers the eID cards that have mostly been produced in 2003 | |
| Number of eID cards that are activated per day, based on the individual CRLs |  |
 |
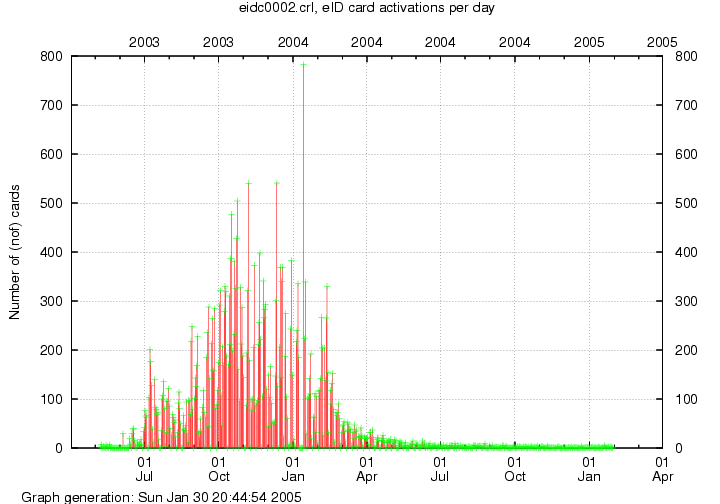 |
Each dot in these graphs corresponds to the number of eID cards that have been activated on that specific day.
Activated means that the eID card's certificates are removed from the crl of that day, i.e., their status toggles from `hold' to `not revoked'.
The calendar days start at day 1 on January 1, 2003, and are increased every subsequent day.
Example: a dot at (date,250) means that 250 eID cards have been activated on that particular date

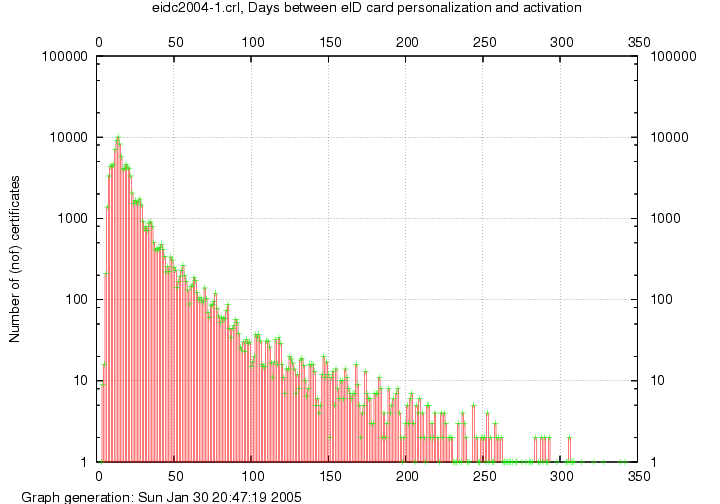
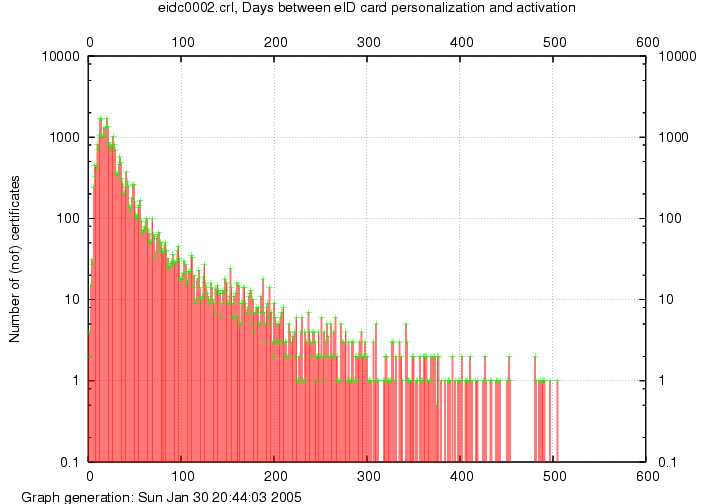
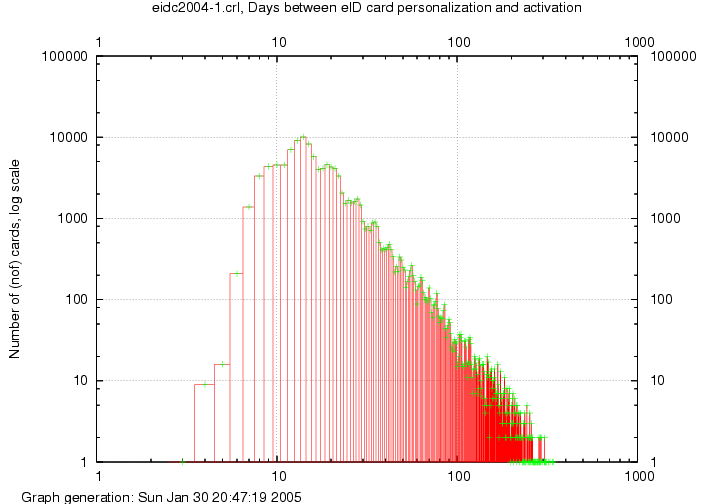
Number of days before a citizen activates his/her eID card
| Information derived from the CRL which covers the eID cards that have mostly been produced in 2005 | Information derived from the CRL which covers the eID cards that have mostly been produced in 2004 | Information derived from the CRL which covers the eID cards that have mostly been produced in 2003 | |
| Logarithmic vertical scale |  |
 |
 |
| Logarithmic vertical and horizontal scales |  |
 |
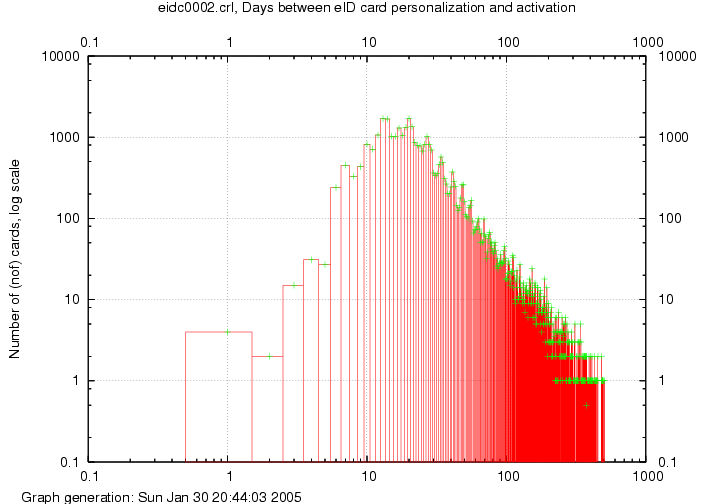 |
Each dot in these graphs corresponds to the number of eID cards that have been activated after that particular number of days after the generation of an eID card's certificates.
Example: a bar on day 80 of height 10 reflects that 10 eID cards have been activated 80 days after the day that the certification authority issued the corresponding eID card certificates.
Note the logarithmic scale of the y-axis in the top most graphs and of both axes: each set of ticks on a logarithmic axis corresponds to a different order of magnitude. Example: between 1 and 10, each tick represents a single unit, between 10 and 100, each tick represents 10 units, between 100 and 1000, each tick represents 100 units, etc.

- Right from the start of the Belgian eID card project (at that time referred to as Belpic -- Belgian ELectronic Personal Identity Card), I started observing the certificate issuing process for Belgian citizens by monitoring the corresponding certificate revocation lists (CRLs).
- The graphs you find on this page are the result of the analysis of these CRLs. As you will see, CRLs contain much more than only information on revoked certificates...

- In addition to these graphs, you also find presentation slides on the technical aspects of the Belgian eID card. These slides are regularly updated.
- I also produced open-source applications to illustrate how digital signatures can be computed with the eID card, and a few applets, i.e., to view the eID card's content (and to change the pin securely), and to show how it can be used with open-source ssh and sftp clients. I use these clients myself with my own eID card, using any type of smartcard reader (I enter my pin using my neat pseudo-secure pinpad if no supported reader with secure pinpad is detected).
- The summary shows the number of eID cards that have been produced/distributed/activated/revoked so far, where the Total CRL sizes graph illustrates how much data should be fetched if one would download all the currently available CRLs.
- the graphs of the individual CRLs show the size of the CRLs that partially cover all eID cards: the CRL which the CA includes in newly issued certificates changes from time to time to ensure that the individual CRLs do not grow too large.
- the last set of graphs illustrate on which day eID cards are frequently activated, and summarize the number of eID card activations per week and per month
 click Here To See All My Bookmarks